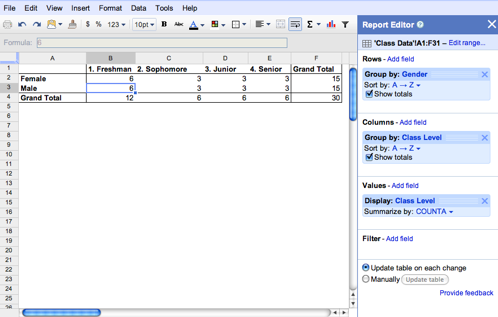
Having large sets of data in a spreadsheet can slow down a computer and can often take minutes just to make a simple, calculation for your large set of data. Now you can instantly sort through large sets of data with Pivot Tables for Google Spreadsheets. Pivot Tables allow you to easily work with the data to find out new, interesting information, you might not have seen just by looking at the charts. If you take this list of students, for example, you can easily create a pivot table by going to Data -> Pivot Table Report. Using this table you can find out the number of students in each grade level by gender.
You can use Pivot Tables to your advantage to alter or find out different sets of information by simply moving a couple of items around or adding some new ones. You can also have your data sorted by formulas, whether you use sum, count, or other simple formula to find out even further information. You can also filter out the type of data you want, whether it’s just males and females or only the Track and Field members for this data set; the choice is up to you.
Check out the video below to see a walk-through of the new Pivot Tables:


